Does Inversion = Recession? Does it Matter?
- 122718
- 2 minutes
A little over 2 weeks ago on December 3, investors everywhere read or heard about an “inverted yield curve”. An inverted yield curve occurs when the interest rate on a longer term debt instrument is lower than the interest rate on a shorter term debt instrument of the same quality. On that day the yield on the 3 year Treasury Bond rose higher than the yield on the 5 year Treasury. While most of those that heard the news of the inversion had little idea of what it even meant, the next morning, if not that very evening, they also read or heard that an inverted yield curve is a sure sign of recession. And so more selling on Wall Street began.
“Are we in a recession?” “Are we heading for a recession?” “Should we go to cash because of the recession?” Questions like this were immediately on everyone’s mind and the talking heads on TV seemed to only add more ammunition for these types of questions.
Since recession is a natural part of an economic cycle, we know one thing for sure: It will likely happen. Since recession is defined in part as a fall in GDP for at least 2 consecutive quarters, we know one other thing for sure: you usually don’t know you’re in one until almost out of it. Finally, the stock market is traditionally viewed as a leading indicator of the economy. In other words, todays’ investment pain predicts tomorrow’s economy. As a leading indicator, it stands to reason that making impulsive investment decisions based on speculation as to whether we are or are not in a recession almost assures those decisions are made after much of a downturn may have occurred.
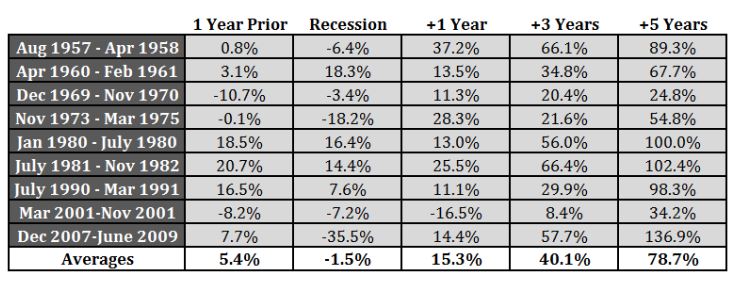
Consider the following information obtained from https://awealthofcommonsense.com. Below are the total returns leading up to, during and after each of the past nine recessions:
Now consider the returns of the S&P 500 since September 30, 2018 – down roughly 13.3%, with some areas of the market like Morningstar large and mid-cap growth Indexes down 13% and 17% respectively (according to Morningstar.com). Rather than react simply by selling into the volatility, take the time to review your holdings and determine if each still has a place in your portfolio.
The takeaway from the table above is not to ignore recession signs or market volatility. Rather, it should be to reassess risk exposure and portfolio allocation. It’s not to “stay the course and you’ll be fine”. Rather, it’s to reassess your specific course and make sure you’re comfortable with the level of risk your portfolio is exposed to. Remember, risk tolerance is not defined by how much you want to make in good times, but how much you’re willing to fluctuate in the uncertain times.
JOE RANDAZZO, JD CFP®
S&P 500 Index is an index of 500 of the largest exchange-traded stocks in the US from a broad range of industries whose collective performance mirrors the overall stock market. Treasury bonds (T-bonds) are long-term debt instruments with maturities of ten years or longer issued in minimum denominations of $1,000. Treasury yield is the return on investment, expressed as a percentage, on the U.S. government's debt obligations. Looked at another way, the Treasury yield is the interest rate that the U.S. government pays to borrow money for different lengths of time. A recession is a significant decline in activity across the economy, lasting longer than a few months. It is visible in industrial production, employment, real income and wholesale-retail trade. The technical indicator of a recession is two consecutive quarters of negative economic growth as measured by a country's gross domestic product (GDP); although the National Bureau of Economic Research (NBER) does not necessarily need to see this occur to call a recession. Gross Domestic Product (GDP) is a measure of output from U.S factories and related consumption in the United States. It does not include products made by U.S. companies in foreign markets. Past performance is no guarantee of future results.